French business interruption losses
frebiloss.RdThe univariate dataset was collected at FFSA and comprise 2387 business interruption losses over the period 1985 to 2000 (for losses above 100,000 French Francs).
Usage
data(frebiloss)Format
danishuni contains 8 columns:
YearThe year of claim occurence.
OccurDateThe day of claim occurence.
PolicyIDThe policy identification number.
ClaimIDThe claim identification number.
ClaimCostOriginal claim cost in French Francs (FFR).
TotalCostOriginal total cost (claim+expense) in French Francs.
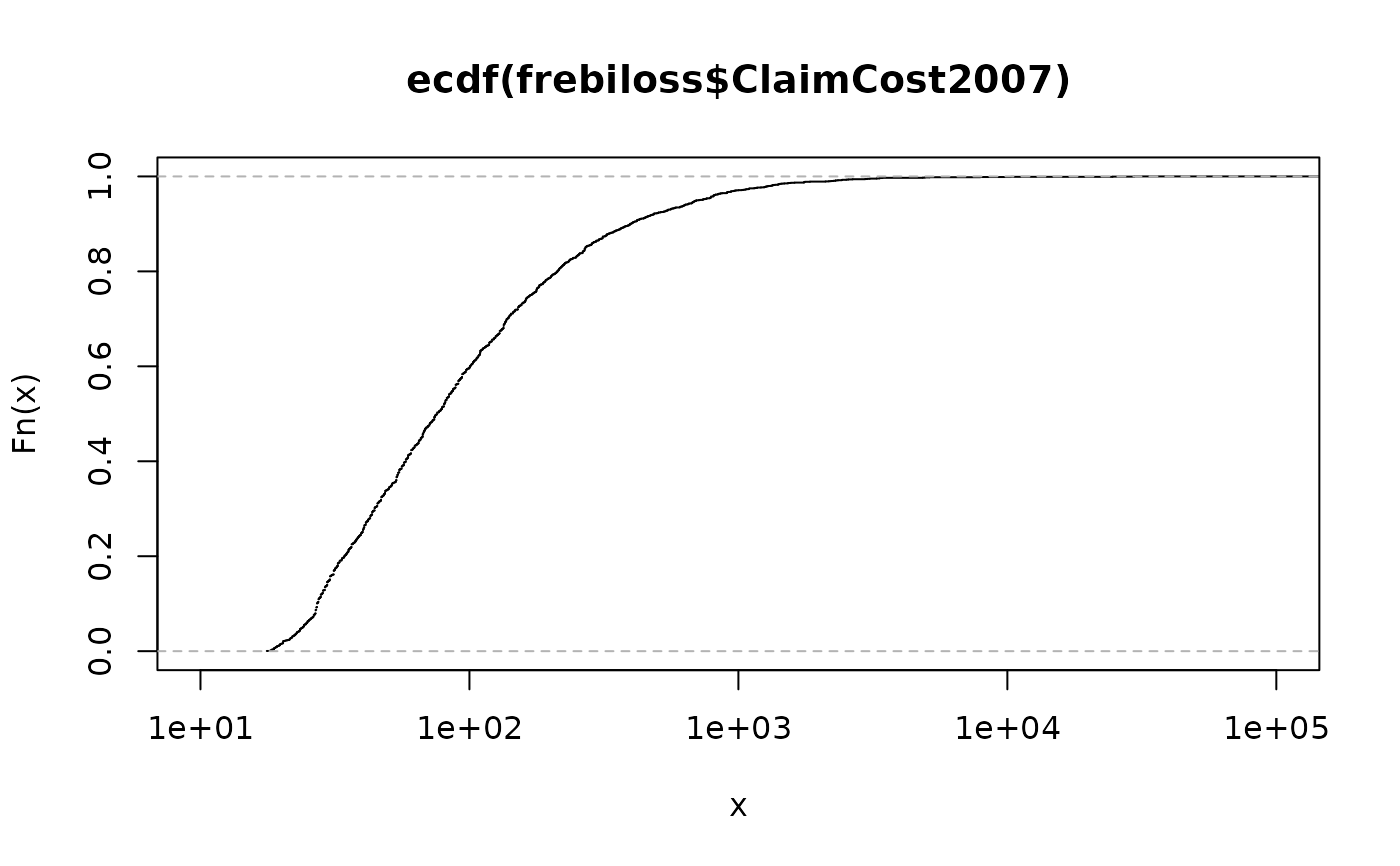
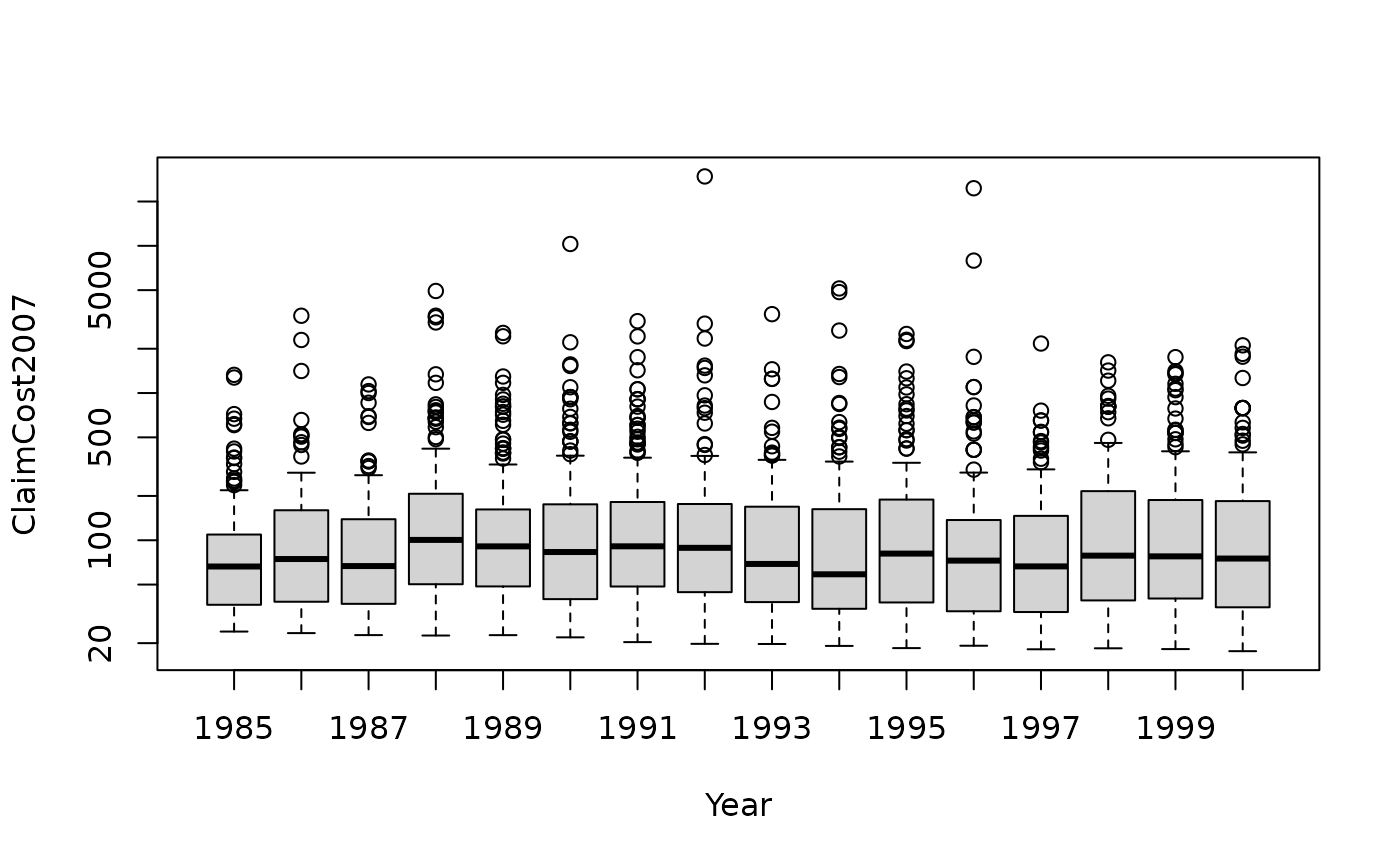
ClaimCost2007Normed claim cost in thousand of 2007 euros (EUR).
TotalCost2007Normed total cost in thousand of 2007 euros (EUR).
References
Dataset used in Zajdenweber (1996). Extreme values in business interruption insurance, Journal of Risk and Insurance, 1, 95-110, doi:10.2307/253518 .

