Norwegian fire insurance dataset
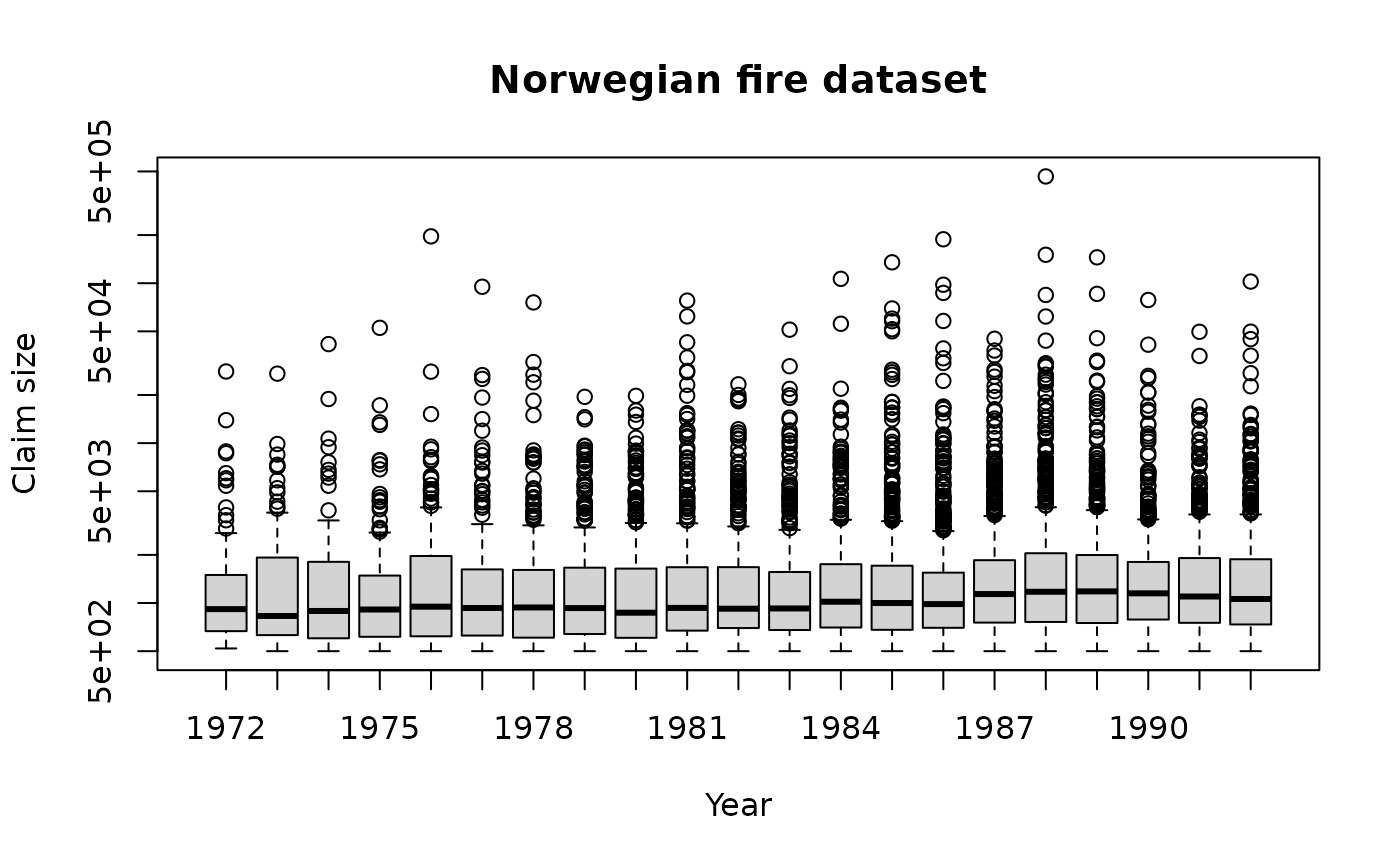
norfire.RdThis dataset comprises 9181 fire losses over the period 1972 to 1992 from an unknown Norwegian company. A priority of 500 thousands of Norwegian Krone (NKR) was applied to get this dataset.
Usage
data(norfire)Format
norfire contains three columns:
YearThe year of claim occurence.
LossThe total loss amount NKR thousands.
Loss2012The total loss amount in thousands of 2012 Norwegian Krone, inflated using the Norwegian CPI.
References
Beirlant, Teugels and Vynckier (1996), Practical Analysis of Extreme Values, Leuven University Press, https://www.jstor.org/stable/2236602.
Beirlant, Matthys and Diercks (2001), Heavy-tailed distributions and rating, ASTIN Bulletin, Vol. 31, Issue 1, doi:10.2143/AST.31.1.993 .
Beirlant, J., Goegebeur, Y., Segers, J. and Teugels, J. L. (2004) Statistics of Extremes: Theory and Applications., Chichester, England: John Wiley and Sons, doi:10.1002/0470012382 .