US Medical claim incremental triangles
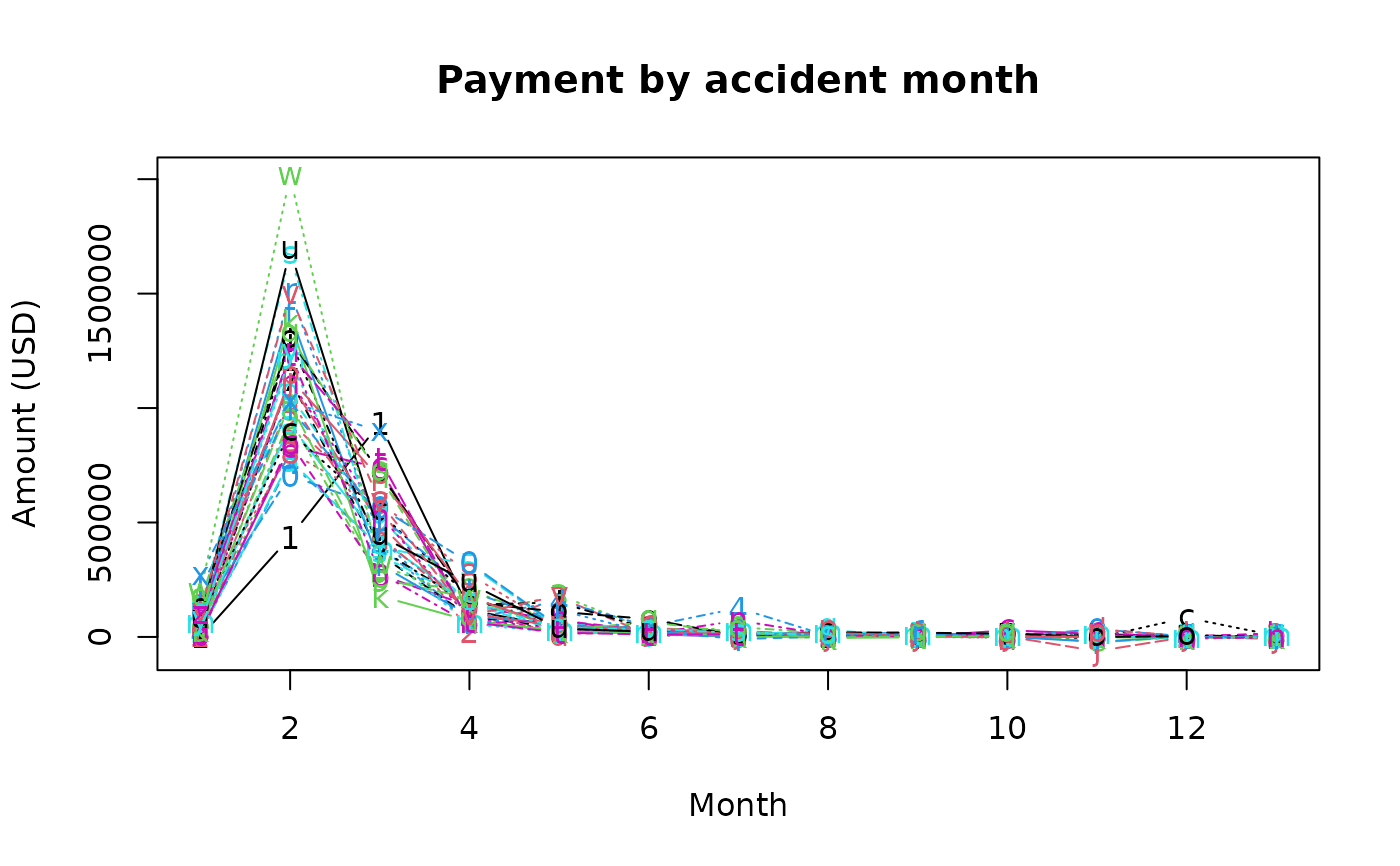
usmedclaim.RdThis dataset comes from Gamage et al. (2007) and contains medical-care payements by month between January 2001 and December 2003. Payments for medical-care coverage come from policies with no deductible or coinsurance. For a given month and a development year, payments are aggregated among members but are cumulated over development year. The payments exclude prescription drugs that typically have a shorter payment pattern than other medical claims.
Usage
data(usmedclaim)Format
usmedclaim is a matrix containing two columns (with members count
and month) and the insurance triangle.
References
Frees (2010), Regression modelling with actuarial and financial applications, Cambridge University Press, doi:10.1017/CBO9780511814372 .
Gamage, J., Linfield, J., Ostaszewski, K. and S. Siegel (2007). Statistical methods for health actuaries - IBNR estimates: An introduction, Society of Actuaries Working Paper, Schaumburg, Illinois.
Examples
# (1) load of data
#
data(usmedclaim)
head(usmedclaim, 10)
#>          members month    DY1     DY2    DY3    DY4    DY5   DY6    DY7   DY8
#> 2001-Jan   11154     1    180  436082 933353 116978  42681 41459   5088 22566
#> 2001-Feb   11118     2   5162  940722 561967  21694 171659 11008  19088  5213
#> 2001-Mar   11070     3  42263  844293 720302  94634 182077 32216  12937 22815
#> 2001-Apr   11069     4  20781  762302 394625  78043 157950 46173 126254  4839
#> 2001-May   11130     5  20346  772404 392330 315888  39197 21360   8721  5452
#> 2001-Jun   11174     6  20491  831793 738087  65526  27768 12185   1493 11265
#> 2001-Jul   11180     7  37954 1126675 360514  89317  40126 16576  16701  2444
#> 2001-Aug   11420     8 138558  806362 589304 273117  36912 16831  19941 13310
#> 2001-Sep   11400     9  28332  954543 246571 205528  60060 15198  42208 17568
#> 2001-Oct   11456    10 104160  704796 565939 323789  45307 32518  26227  7976
#>            DY9  DY10  DY11 DY12  DY13
#> 2001-Jan  4751  3281  -188 1464  1697
#> 2001-Feb  4337  7844  2973 4061 10236
#> 2001-Mar  1754  4695  1326  758  2177
#> 2001-Apr   337  1573  9573 1947  5937
#> 2001-May 16627  2118  4119 5666 -1977
#> 2001-Jun  1805 29278 13020 2967   -83
#> 2001-Jul  8266 11310  8006 1403  3124
#> 2001-Aug  8619  4679  3094 4609   236
#> 2001-Sep  1686  9897  3367 2062   421
#> 2001-Oct  3364   992 33963 2200  1293

# (2) graph of data
#
matplot(t(as.matrix(usmedclaim[,-(1:2)])), type="b", main="Payment by accident month",
    xlab="Month", ylab="Amount (USD)")